


Rapid Response: Election-related hangxiety
AI reassessment fuels market selloff


Yesterday, the post-election rally gave way to questions about the economics of the AI investment cycle, the quality of reported technology earnings, and whether market leadership is shifting away from the Magnificent Seven. The Nasdaq-100 fell 6.4%, its worst single-day decline since the COVID crash in March 2020. The selloff was concentrated in technology and AI-related companies, with the Philadelphia Semiconductor Index dropping more than 12%.
In the face of significant market volatility, investors should remain well diversified and focus on equity strategies that balance large-cap technology exposure with investments in other sectors of the market. With that in mind, we offer four recommendations to help investors navigate the post-election selloff.
- Overweight higher quality, income producing equity strategies designed to help your portfolio better weather market volatility.
- Ensure that your portfolio includes a mix of U.S. and non-U.S. equities. Remember that European markets not only provide diversification through exposure to different political and economic regimes but are also less concentrated in the technology sector than U.S. markets.
- Avoid panic reactions. Selling into market declines rarely maximizes returns. Even if the market continues to fall after the sale, many investors fail to reestablish their equity positions before the next market rally.
- For taxable accounts, consider adding a continuous tax overlay to take advantage of significant declines in certain names by harvesting losses to offset current or future capital gains.
What’s driving the selloff?
- The catalyst is broader than politics. Weakness in data-center developers, power suppliers, and infrastructure companies preceded a wider reassessment of AI valuations. Constraints on new capacity could lower hyperscaler capital spending but also weaken the revenue and financing assumptions supporting the ecosystem.1
- The real issue is not the price of tech stocks but whether large-cap technology companies can generate the earnings growth necessary to support current valuations. While Q3 earnings have generally been very strong (with approximately 80% of companies reporting), large-cap tech has underperformed Wall Street expectations.2 Moreover, the quality of large-cap tech earnings has become murkier given substantial crossholdings among hyperscalers, mega IPOs, and the largest AI players. Some large technology companies also appear to be experiencing headwinds in their core businesses due to AI. One example is Alphabet, whose most recent earnings report revealed weaknesses in its core advertising business.3
- Additional macro headwinds from persistently high interest rates and inflation have reinforced a higher-for-longer rate environment, putting pressure on long-duration technology valuations and making them more vulnerable to even small earnings disappointments.
- Extreme crowding is amplifying market reactions. According to Deutsche Bank analysts, technology positioning was close to its peak at the beginning of October.4 As positioning unwound, many of the best-performing stocks became some of the worst performers over the past four weeks.
- Fortunately, the other 493 stocks in the S&P 500, outside of the Magnificent Seven, have stepped in to carry the load on earnings growth, with the majority reporting earnings that exceeded market estimates.5
The AI aftermath: Rethinking the ecosystem
The term “hangxiety” captures the shift from the enthusiasm of the post-election rally to a more sober assessment of the price paid for growth. The central question is not whether AI will transform the economy, but which businesses will earn attractive returns after funding the infrastructure needed to deliver it. The internet similarly transformed the economy in the early 2000s, but many of the pioneering internet companies did not reap the benefits of that transformation.
The data-center selloff on November 4 was an early sign of that reassessment. Many companies focused on AI infrastructure buildouts experienced significant declines — but initially, only those directly affected felt the sting of increased market skepticism.
The post-election rally was fueled in part by the idea that postponing data-center projects could improve hyperscaler free cash flow. However, the euphoria was short-lived as the market began to recognize that lower capital expenditure is not necessarily a net gain for an interconnected ecosystem whose growth assumptions depend on continued investment.
| HOW CROSSHOLDINGS COMPLICATE EARNINGS Alphabet’s investment in SpaceX illustrates how crossholdings can materially affect reported earnings, even when underlying operations remain relatively strong. Alphabet’s original $900 million investment in SpaceX had appreciated to approximately $94.2 billion by June 2026.6 In the third quarter, Alphabet recorded a loss of more than $8 billion on its equity investments, driven primarily by SpaceX, reducing reported earnings by approximately $0.55 per share to $2.12. Without that investment-related loss, earnings would have been approximately $2.67 per share, all else equal.7 To underscore the earnings volatility introduced by these crossholdings, consider the previous quarter. Alphabet’s second-quarter earnings included approximately $98 billion in other income gains, primarily related to equity investments.8 The takeaway: An increasingly interconnected technology ecosystem can introduce significant earnings volatility unrelated to a company’s core business performance, making it harder for investors to assess where value lies. This is for illustrative purposes only and not a recommendation. |
From the Magnificent Seven to the Formidable 493
After years of mega-cap technology dominance, the rest of the market is beginning to reclaim earnings leadership. Recent earnings reports show a noticeable reversal. Blended year-over-year earnings growth for the Magnificent Seven stands at approximately 22%, compared with 32.6% for the other 493 names in the S&P 500.9 Importantly, the Magnificent Seven’s third-quarter reported earnings fell short of expectations by 14.7% in aggregate, versus a 1.9% beat for the broader index reporting group.10
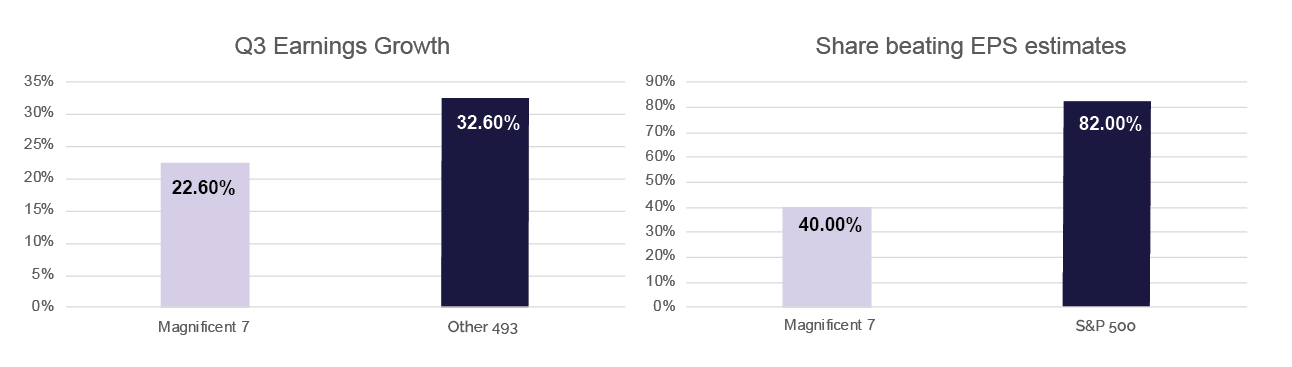
Source: FactSet, “‘Mag 7’ Now Reporting Lower Earnings Growth Than the Other 493 S&P 500 Companies for Q3,”
November 3, 2026.
What it means for portfolios
We have been emphasizing the risks of concentration in U.S. mega-cap technology and the potential benefits of diversification into international equities and small- and mid-cap U.S. companies. The objective is not to abandon technology, but to reduce dependence on a narrow set of highly valued names while identifying businesses with sustainable earnings, attractive cash flow, and reasonable valuations.
This earnings season and the election-related selloff in AI and technology provide a fundamental rationale for that positioning. Broader earnings growth and positive surprises beyond the Magnificent Seven do not guarantee outperformance, but they suggest that the opportunity set is no longer defined solely by a few dominant technology franchises. A comparison of year-to-date performance between the market-cap-weighted and equal-weighted S&P 500 indices helps to punctuate this point.
Our recommendation is to stay invested rather than sell into a declining market, while ensuring that your portfolio is well diversified. Additionally, market corrections can also present opportunities for tax-loss harvesting, allowing investors to realize losses that can offset current or future capital gains.
Beyond the Magnificent Seven: Broadening market leadership
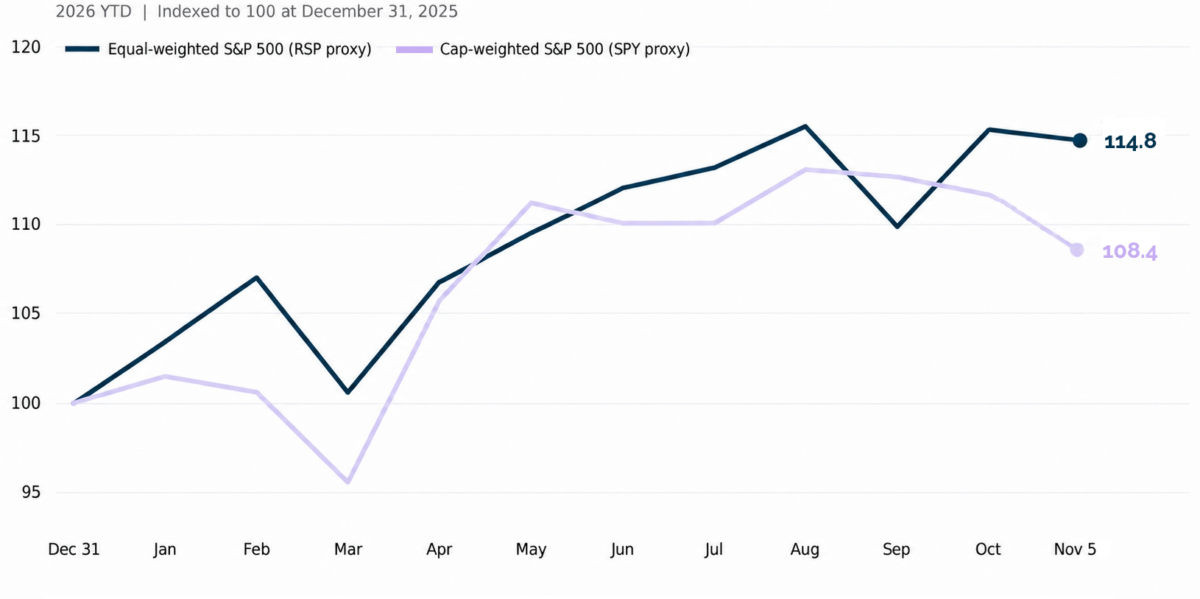
Source: Bloomberg, November 5, 2026.
Conclusion
Volatility is likely to continue as the market untangles the impact of the increasingly interconnected ecosystem surrounding the AI-boom and large-cap technology. Slower infrastructure spending may relieve capital pressure for some firms while reducing the demand that supports others.
The prospect of restrictions on data-center development, broader questions about the magnitude of AI-driven productivity gains, and AI’s potentially disruptive impact on even stand-out business models such as Google’s all combine to give the market a strong bout of hangxiety. While it’s tempting to try to time the market and sell into weakness, history suggests that maintaining consistent risk exposure, tailored to individual circumstances, is a better way to navigate both rising and falling markets successfully.
&Partners Investment Team
The &Partners Investment Team brings extensive experience, deep market knowledge, and a disciplined approach to managing capital.
In keeping with our mission to bring institutional-quality research, analysis, and investment strategies to financial advisors and their clients, our Investment Team is readily accessible to &Partners’ advisor community. This concierge approach allows us to provide personalized investment guidance that supports advisors in helping them achieve their financial goals.
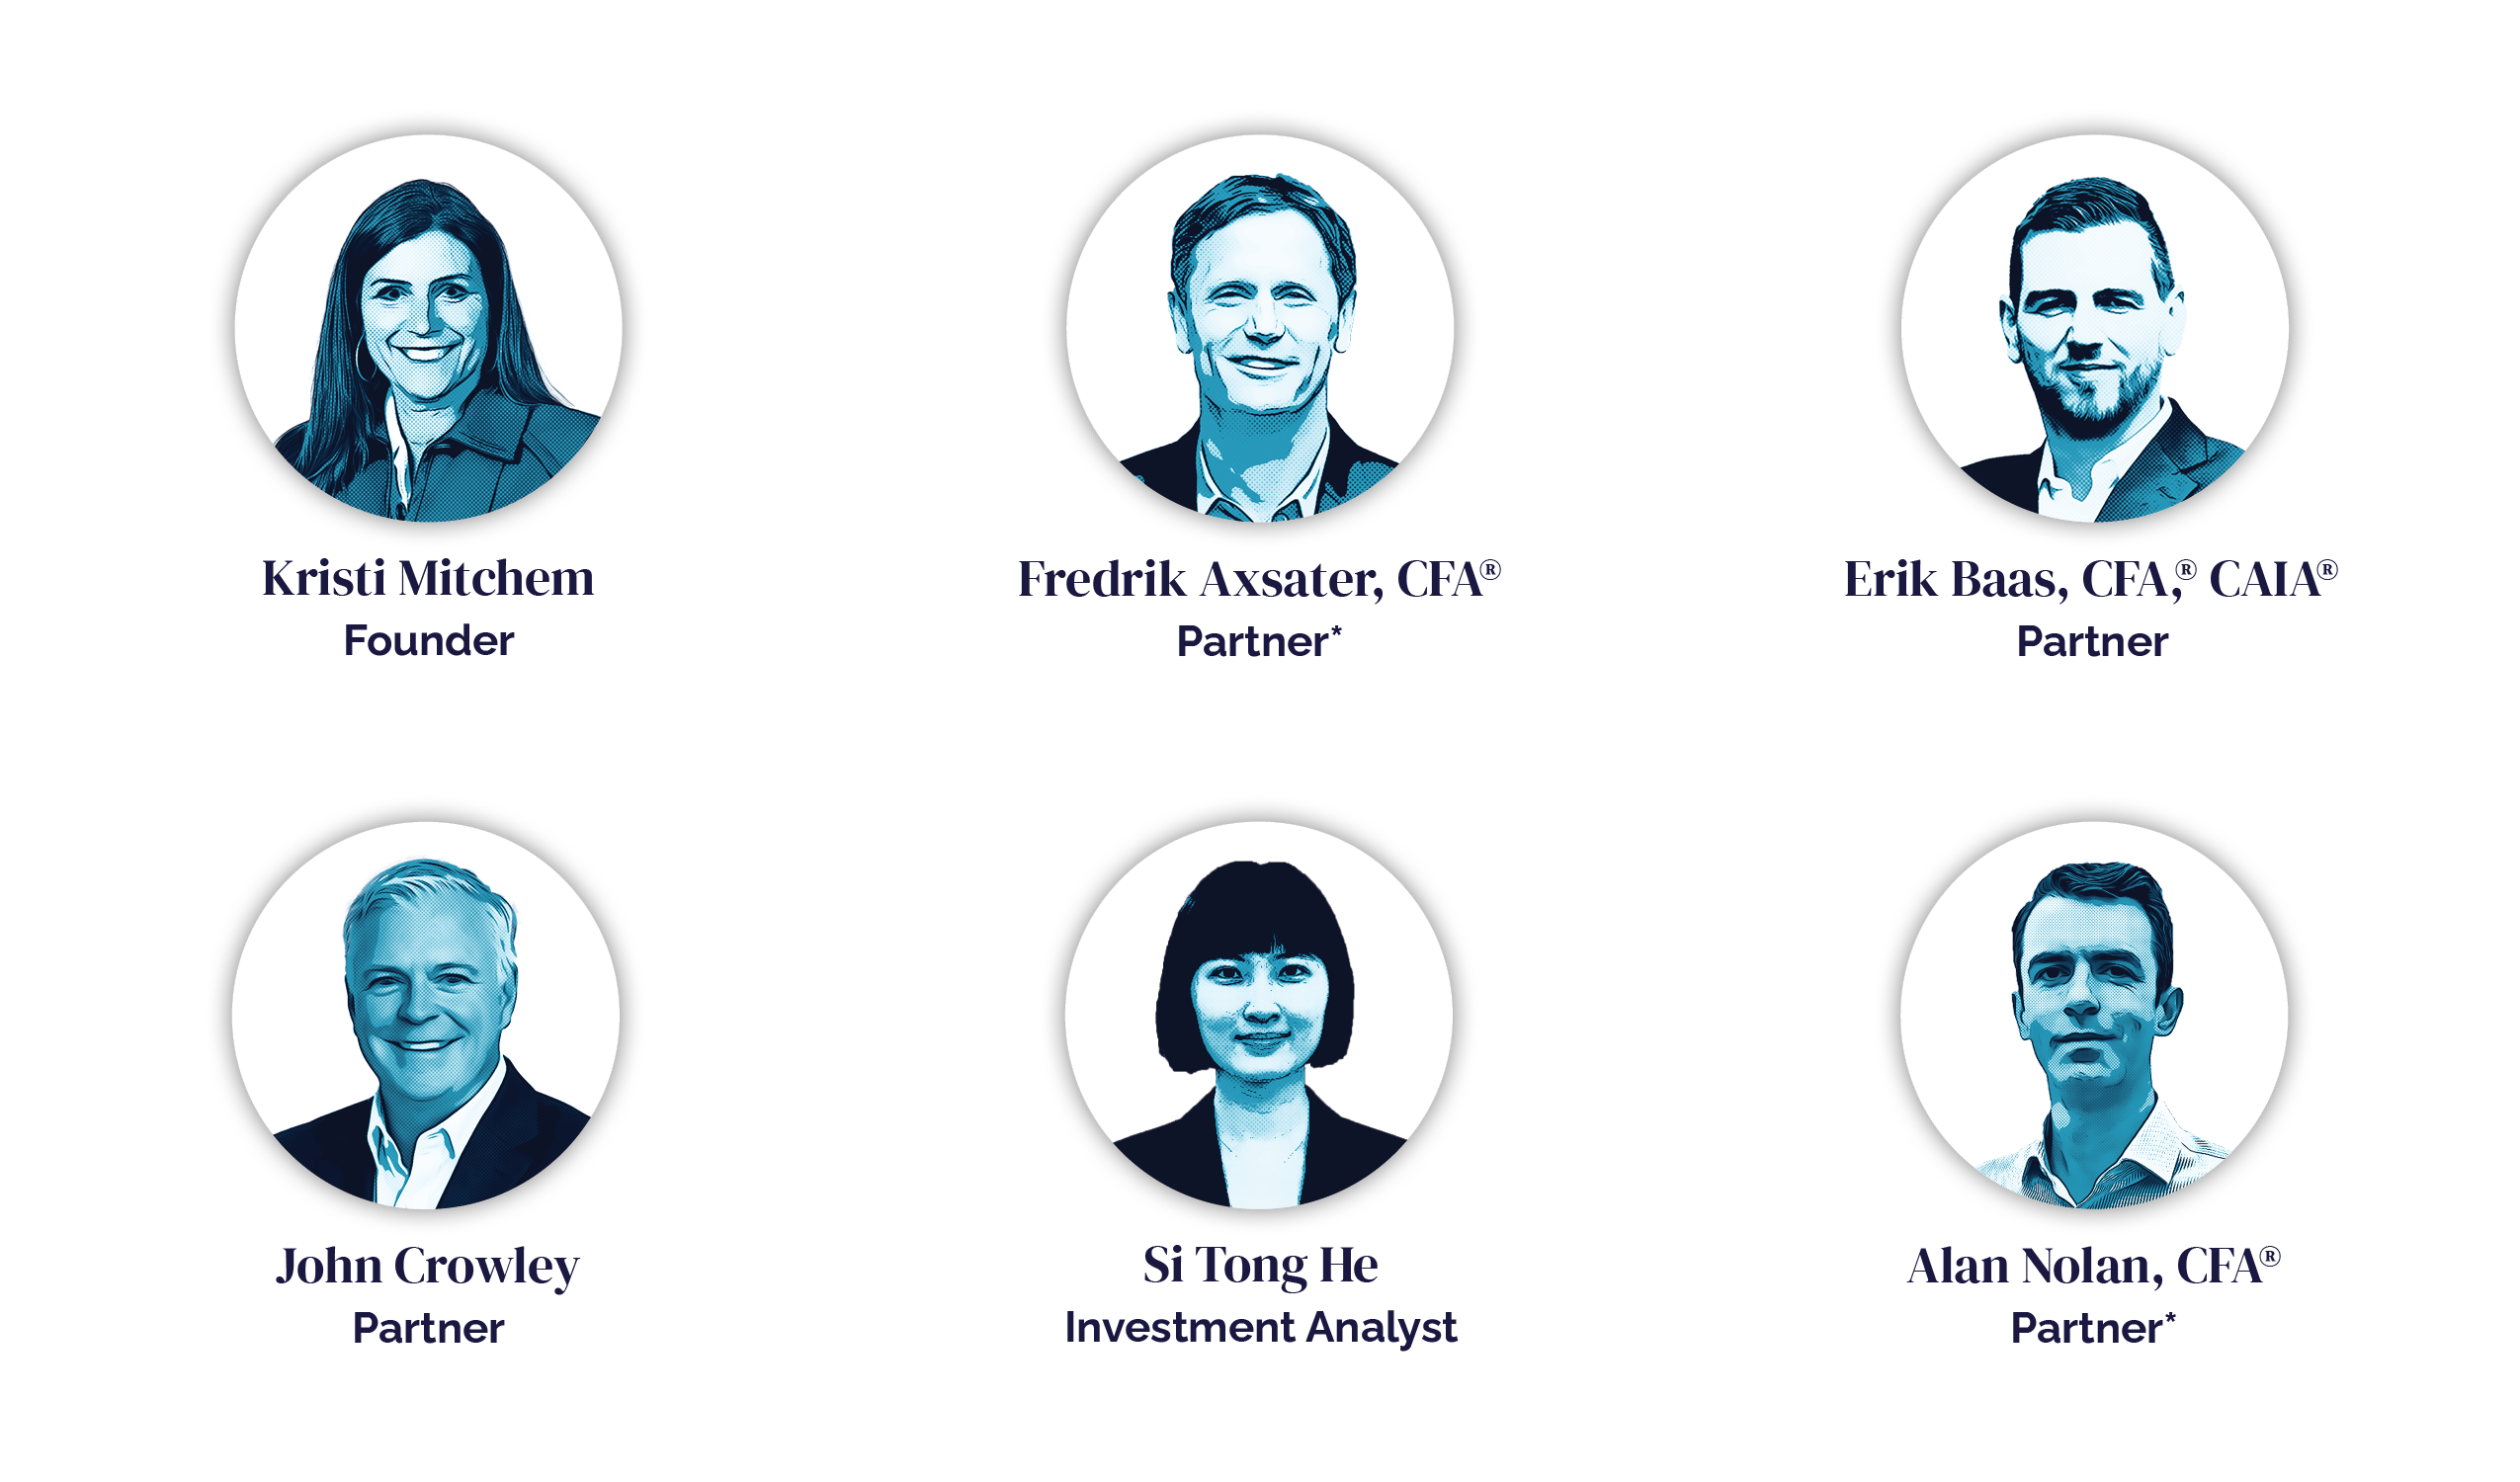
*Fredrik and Alan are third-party consultants affiliated with &Partners.
- Rob Isbitts, “Unprecedented AI CapEx risks toppling the entire stock market,” July 4, 2026, finance.yahoo.com/markets/stocks/articles/unprecedented-ai-capex-risks-toppling-140002807.html.
- FactSet, “Mag 7 Now Reporting Lower Earnings Growth Than the Other 493 S&P 500 Companies for Q3,” November 3, 2026, insight.factset.com/mag-7-now-reporting-lower-earnings-growth-than-the-other-493-sp-500-companies-for-q3.
- Bloomberg, bloomberg.com/news/articles/2026-10-28/alphabet-reports-disappointing-revenue-income-shares-drop.
- Deutsche Bank, Taking stock of the tech unwind, October 23, 2026.
- FactSet, “Mag 7 Now Reporting Lower Earnings Growth Than the Other 493 S&P 500 Companies for Q3,” November 3, 2026, insight.factset.com/mag-7-now-reporting-lower-earnings-growth-than-the-other-493-sp-500-companies-for-q3.
- Rich Duprey, “Alphabet turned &800 million in SpaceX into $94 billion — here’s the lesson for investors, August 14, 2026, finance.yahoo.com/markets/stocks/articles/alphabet-turned-900-million-spacex-135032220.html.
- Alphabet, Q3 Earnings Call, October 28, 2026, abc.xyz/investor/events/event-details/2026/2026-Q3-Earnings-Call-2026-Ujou16CTw9/default.aspx.
- Bloomberg, bloomberg.com/news/articles/2026-07-22/alphabet-posts-98-billion-in-second-quarter-investment-gains.
- FactSet, “Mag 7 Now Reporting Lower Earnings Growth Than the Other 493 S&P 500 Companies for Q3,” November 3, 2026, insight.factset.com/mag-7-now-reporting-lower-earnings-growth-than-the-other-493-sp-500-companies-for-q3.
- FactSet, “Mag 7 Now Reporting Lower Earnings Growth Than the Other 493 S&P 500 Companies for Q3,” November 3, 2026, insight.factset.com/mag-7-now-reporting-lower-earnings-growth-than-the-other-493-sp-500-companies-for-q3.
Disclosures
Investment and portfolio diversification is generally recommended to reduce the overall volatility of a portfolio, but diversification will not assure a gain or prevent a loss (especially in declining markets). Diversification is generally more effective to reduce volatility when a portfolio includes investments that are uncorrelated or negatively correlated with one another from a performance and investment risk standpoint. Historical correlation of investment performance correlation (or lack thereof) is, by its nature, backward looking and does not guarantee the correlation (or lack thereof) will continue or remain constant. Diversification and strategic asset allocation do not assure profit or protect against loss in declining markets.
The material has been prepared or is distributed solely for informational purposes and is not a solicitation or an offer to buy any security or instrument or to participate in any trading strategy. Please consult with your financial professional to determine what might be appropriate for your situation. Past performance is not indicative of future results.
It is not possible to invest directly in an index. Indexes are unmanaged and do not reflect the deduction of fees or expenses. All investments are subject to risks, including the risk of loss.
The S&P 500® is widely regarded as the best single gauge of large-cap U.S. equities. The index includes 500 leading companies and covers approximately 80% of available market capitalization.
The S&P 500 Equal Weight Index (EWI) is the equal-weight version of the widely used S&P 500. The index includes the same constituents as the capitalization-weighted S&P 500, but each company in the S&P 500 EWI is allocated a fixed weight, or 0.2% of the index total at each quarterly rebalance.
The Philadelphia Semiconductor Index is a modified market capitalization-weighted index composed of the 30 largest U.S.-listed semiconductor companies involved in the design, distribution, manufacturing, and sale of microchips and semiconductor equipment.
The Nasdaq-100 Index® includes 100 of the largest domestic and international non-financial companies listed on the Nasdaq Stock Market based on market capitalization. The index reflects companies across major industry groups including computer hardware and software, telecommunications, retail/wholesale trade, and biotechnology. It does not contain securities of financial companies including investment companies.
&Partners℠ is the enterprise trade/marketing name for Ampersand Partners LLC, a Delaware limited liability holding company, and its subsidiary, &Partners LLC, a Tennessee limited liability company. Securities and advisory services offered through &Partners LLC, member FINRA, SIPC. MR9224301.1.
Related content

Rapid Response: Back to bAIsics
As concerns over AI spending fuel market volatility, the &Partners Investment Team recommends maintaining a long-term perspective and staying diversified.
Should advisors consider private equity funds that trade like mutual funds?
Are there private equity funds that work more like mutual funds? The &Partners Investment Team explains the risks of holding illiquid private investments in a liquid wrapper.